GE-McKinsey Nine-Field Matrix: PowerPoint Template
GE-McKinsey Nine-Field Matrix: PowerPoint Template

Introduction
The GE-McKinsey Nine-Field Matrix helps companies identify which business units to invest in and which to divest or restructure.
It provides a framework for strategic decision-making based on an objective analysis of a company's business portfolio.
What is the GE-McKinsey 9 Nine-Field Matrix?
The GE-McKinsey Nine-Field Matrix is a business strategy tool to assess a company's portfolio.
General Electric and McKinsey & Company developed it in the 1970s to help businesses decide which business units to invest in and which to divest.
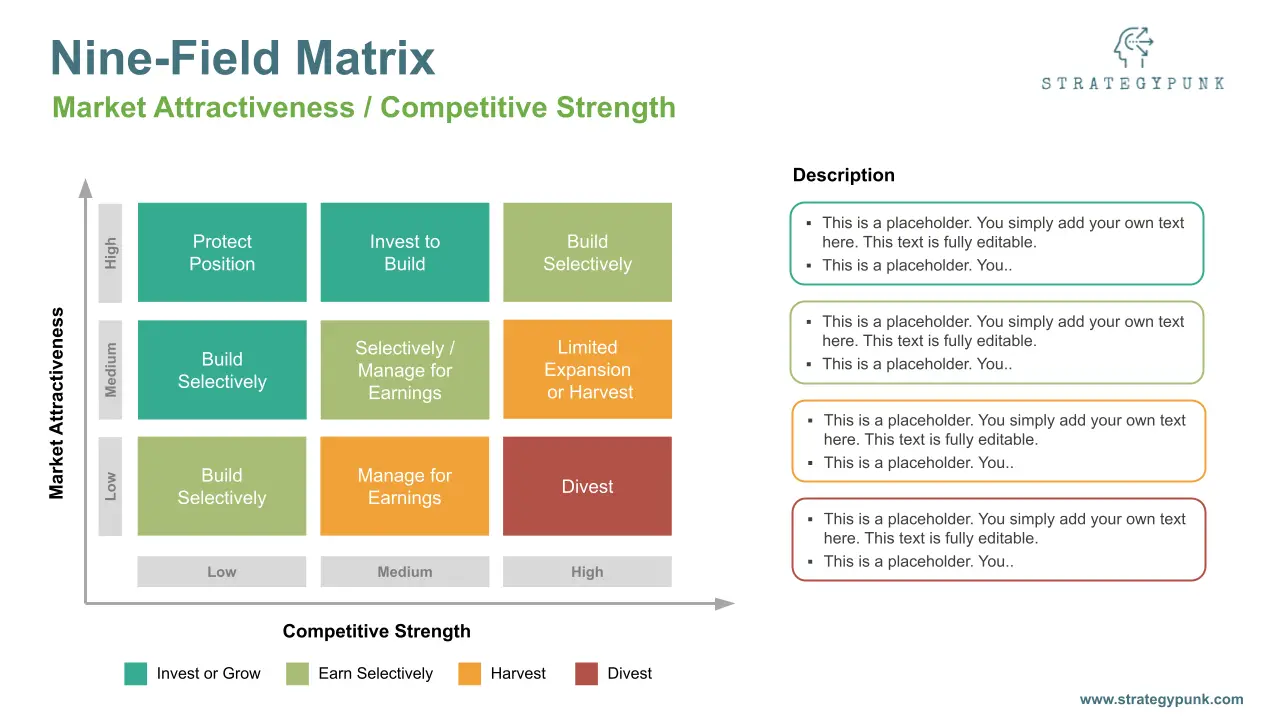
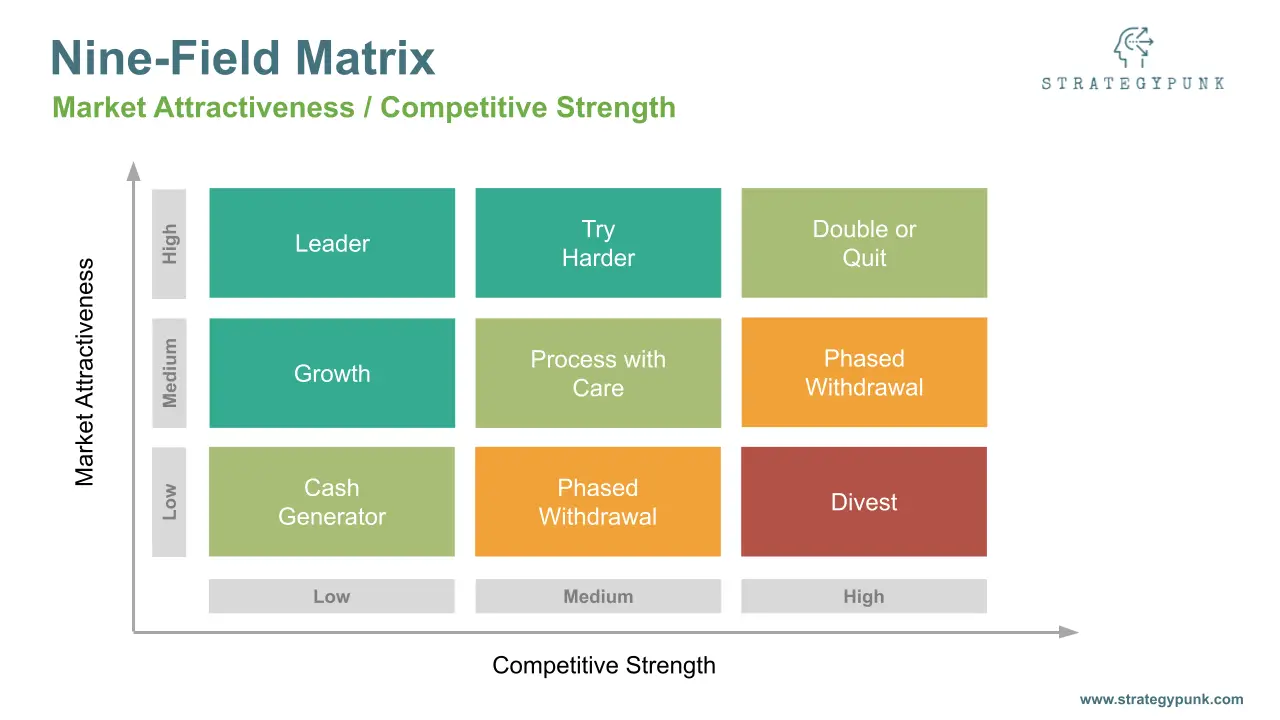
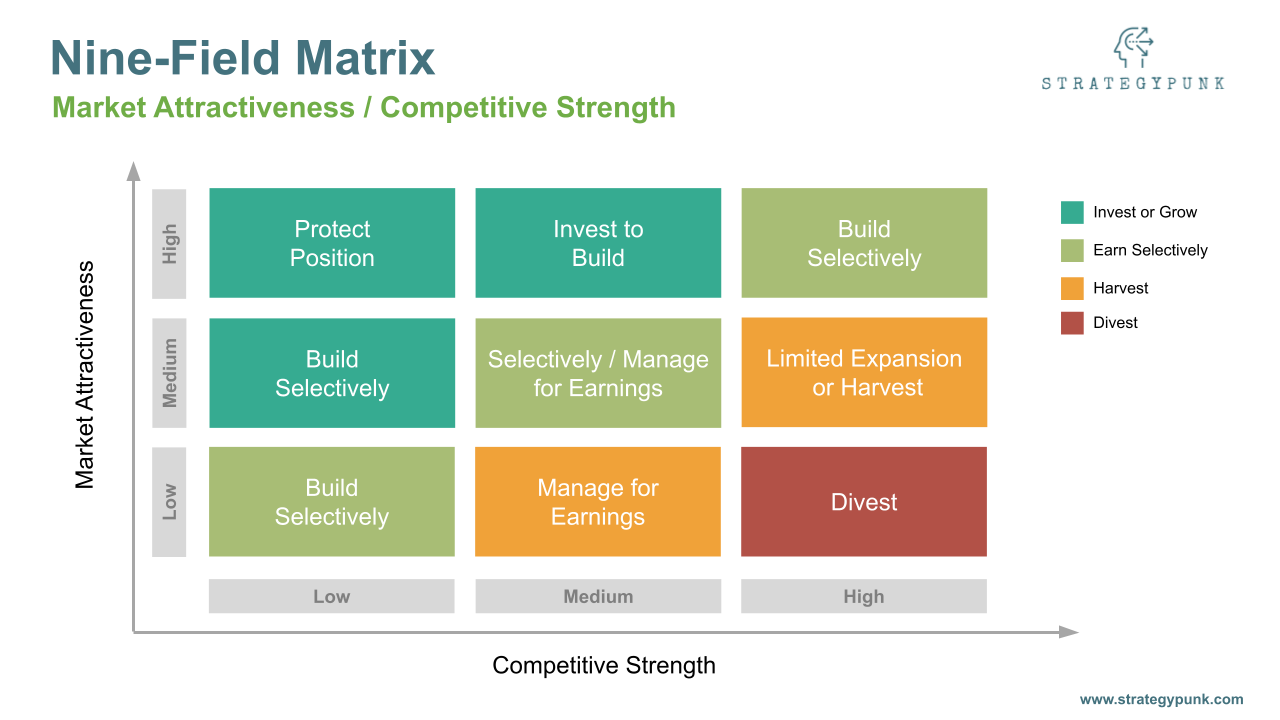
The matrix consists of a 3x3 grid, with the y-axis representing industry or market attractiveness and the x-axis representing competitive strength.
Each axis is divided into three categories: high, medium, and low.
The industry attractiveness axis considers market size, growth rate, profitability, and competition factors.
The business strength axis considers market share, profitability, and brand strength.
What are the nine cells of the GE-McKinsey Nine-Field Matrix?
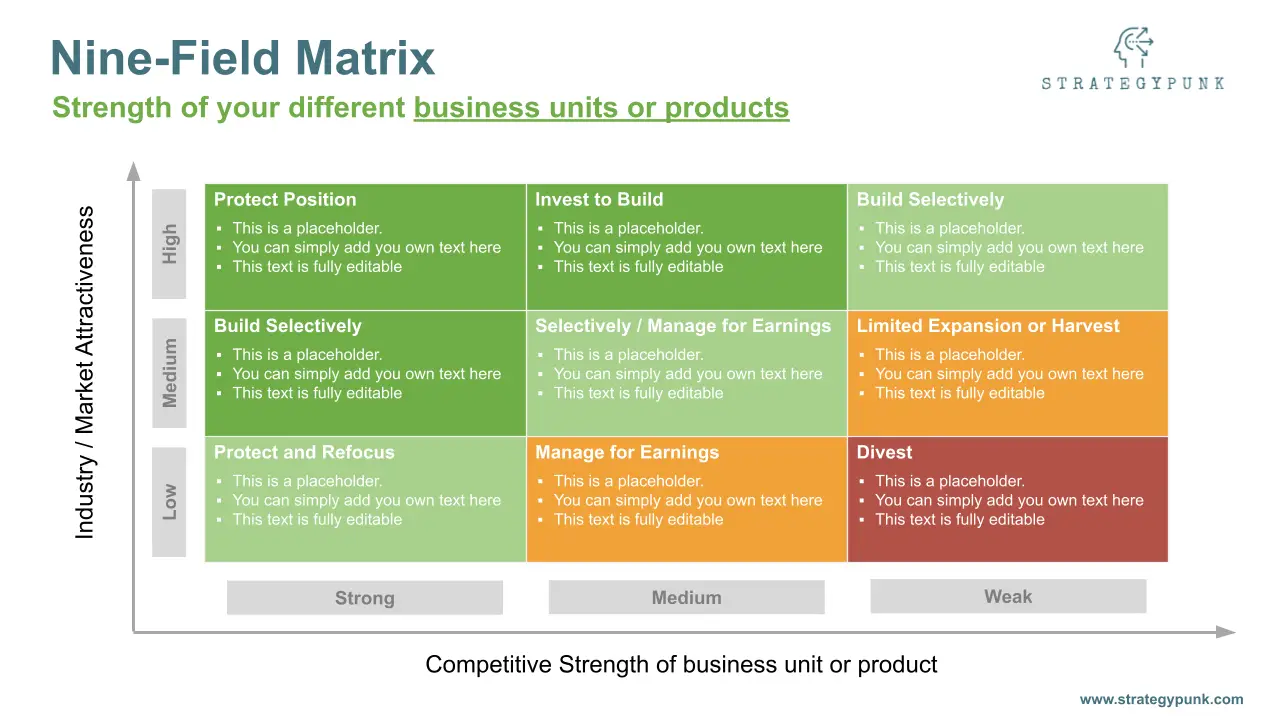
Each company's business unit is then placed in one of the nine cells of the matrix based on its industry attractiveness and business strength.
The nine cells are:
- High industry attractiveness, high business strength: These are the most attractive businesses for a company to invest in, as they have both a robust competitive position and are in an attractive industry.
- Medium industry attractiveness, high business strength: These businesses have a solid competitive position but are in a less attractive industry.
- Low industry attractiveness, high business strength: These businesses may be profitable but unattractive and need to be more sustainable in the long run.
- High industry attractiveness, medium business strength: These businesses are in an attractive industry but may need a stronger competitive position.
- Medium industry attractiveness, medium business strength: These businesses are less attractive and may need a stronger competitive position.
- Low industry attractiveness, medium business strength: These businesses are unattractive and may need to be more profitable in the long run.
- High industry attractiveness, low business strength: These businesses have potential in an attractive industry but must be competitive.
- Medium industry attractiveness, low business strength: These businesses have potential, but they are in a less attractive industry and need to be more competitive.
- Low industry attractiveness, low business strength: These businesses need to be competitive and are in an attractive industry.
What are the advantages of using the GE-McKinsey Nine-Field Matrix?
The GE-McKinsey Nine-Field Matrix is helpful for businesses in assessing their portfolio and making strategic decisions.
Some advantages of using this matrix include:
- Comprehensive analysis: The GE-McKinsey Nine-Field Matrix provides a comprehensive analysis of a company's entire business portfolio, including business units and market segments, enabling companies to identify strengths, weaknesses, opportunities, and threats.
- Objective analysis: The matrix provides an objective analysis of a company's business units based on two key metrics—industry attractiveness and business strength. This allows companies to make informed decisions about investment, divestment, and restructuring.
- Strategic focus: The matrix helps companies decide which business units to invest in, which ones to divest, and which to restructure, enabling them to optimize their portfolio and maximize their returns.
- Clear visualization: The matrix provides a clear visualization of a company's business portfolio, with each business unit placed in one of the nine cells of the matrix, making it easy for companies to identify their most and least attractive business units.
- Flexibility: The matrix can be adapted to suit a company's specific needs and goals, enabling companies to tailor the analysis to their business and industry.
Overall, the GE-McKinsey Nine-Field Matrix is a valuable tool for businesses to assess their portfolio and make strategic decisions based on objective analysis.
It enables companies to optimize their portfolio and maximize their returns by focusing on their most attractive business units and divesting or restructuring their least attractive ones.
What are the limitations of the GE-McKinsey Nine-Field Matrix?
While the GE-McKinsey Nine-Field Matrix is a valuable tool for businesses to assess their portfolio and make strategic decisions, its use also has limitations.
These limitations include:
- Subjectivity: The matrix relies on subjective judgments of market attractiveness and competitive strength, which can vary depending on the analyst's perspective. This subjectivity can lead to different results when different analysts use the matrix.
- Limited metrics: The matrix only considers market attractiveness and competitive strength, which may not fully capture a company's business portfolio's complexities. Other important metrics, such as customer satisfaction and innovation, should be included in the matrix.
- Lack of dynamic analysis: The matrix is a static tool that only provides a snapshot of a company's business portfolio at a particular time. It does not consider changes in the market, industry, or economy that may affect a company's business units in the future.
- Difficulty in data gathering: Accurate and reliable data on industry attractiveness and business strength can be challenging, particularly for smaller companies with limited resources.
- Oversimplification: The matrix may need to be more balanced with the complexities of a company's business portfolio, leading to overly simplistic or inaccurate conclusions.
- Lack of consideration for interdependencies: The matrix evaluates each business unit independently and needs to consider their interdependencies. For example, a company may choose to divest a business unit that is not performing well, but this decision may hurt other business units that rely on it.
Overall, while the GE-McKinsey Nine-Field Matrix is a valuable tool for businesses to assess their portfolio, it is essential to recognize its limitations and use it with other strategic analysis tools and methodologies.
What is the purpose of the GE-McKinsey Nine-Field Matrix?
The purpose of the GE-McKinsey Nine-Field Matrix is to help businesses make strategic decisions about their business portfolio.
The matrix evaluates each company's business units based on two key metrics: industry attractiveness and business strength. Its purpose is to determine which business units to invest in, divest, or restructure.
The matrix helps businesses identify their most attractive and least attractive business units and focus on maximizing their returns by investing in their most attractive units and divesting or restructuring their least attractive ones.
This helps companies to optimize their portfolio and align their resources with their business strategy.
What are the key differences between the BCG Matrix and the GE-McKinsey Nine-Field Matrix?
The BCG Matrix and the GE-McKinsey Matrix are both business strategy tools used to analyze a company's business portfolio, but there are some critical differences between them.
Critical differences between BCG Matrix and GE McKinsey Matrix
- Focus: The BCG Matrix focuses on a company's product portfolio, while the GE-McKinsey Matrix considers a company's entire business portfolio, including business units and market segments.
- Metrics: The BCG Matrix evaluates a company's products based on market share and market growth rate, while the GE-McKinsey Matrix evaluates a company's business units based on industry attractiveness and business strength.
- Matrix structure: The BCG Matrix is two-by-two, while the GE-McKinsey Matrix is three-by-three.
- Business unit categorization: The BCG Matrix categorizes business units as either "stars," "cash cows," "question marks," or "dogs." The GE-McKinsey Matrix categorizes business units based on their industry attractiveness and business strength.
- Strategic focus (Strategic Focus Framework): The BCG Matrix helps companies determine which products to invest in, which to divest, and which to hold onto. The GE-McKinsey Matrix helps companies decide which business units to invest in, which ones to clear, and which to restructure.
In summary, the BCG Matrix is a tool used to analyze a company's product portfolio, while the GE-McKinsey Matrix is used to analyze a company's entire business portfolio. The two matrices use different metrics and categorization schemes to evaluate a company's portfolio and have different strategic focuses.
We published a Guide and Template on the BCG Growth Matrix in both Excel and PowerPoint format:
BCG Matrix: Introduction and Excel Template
 StrategyPunk
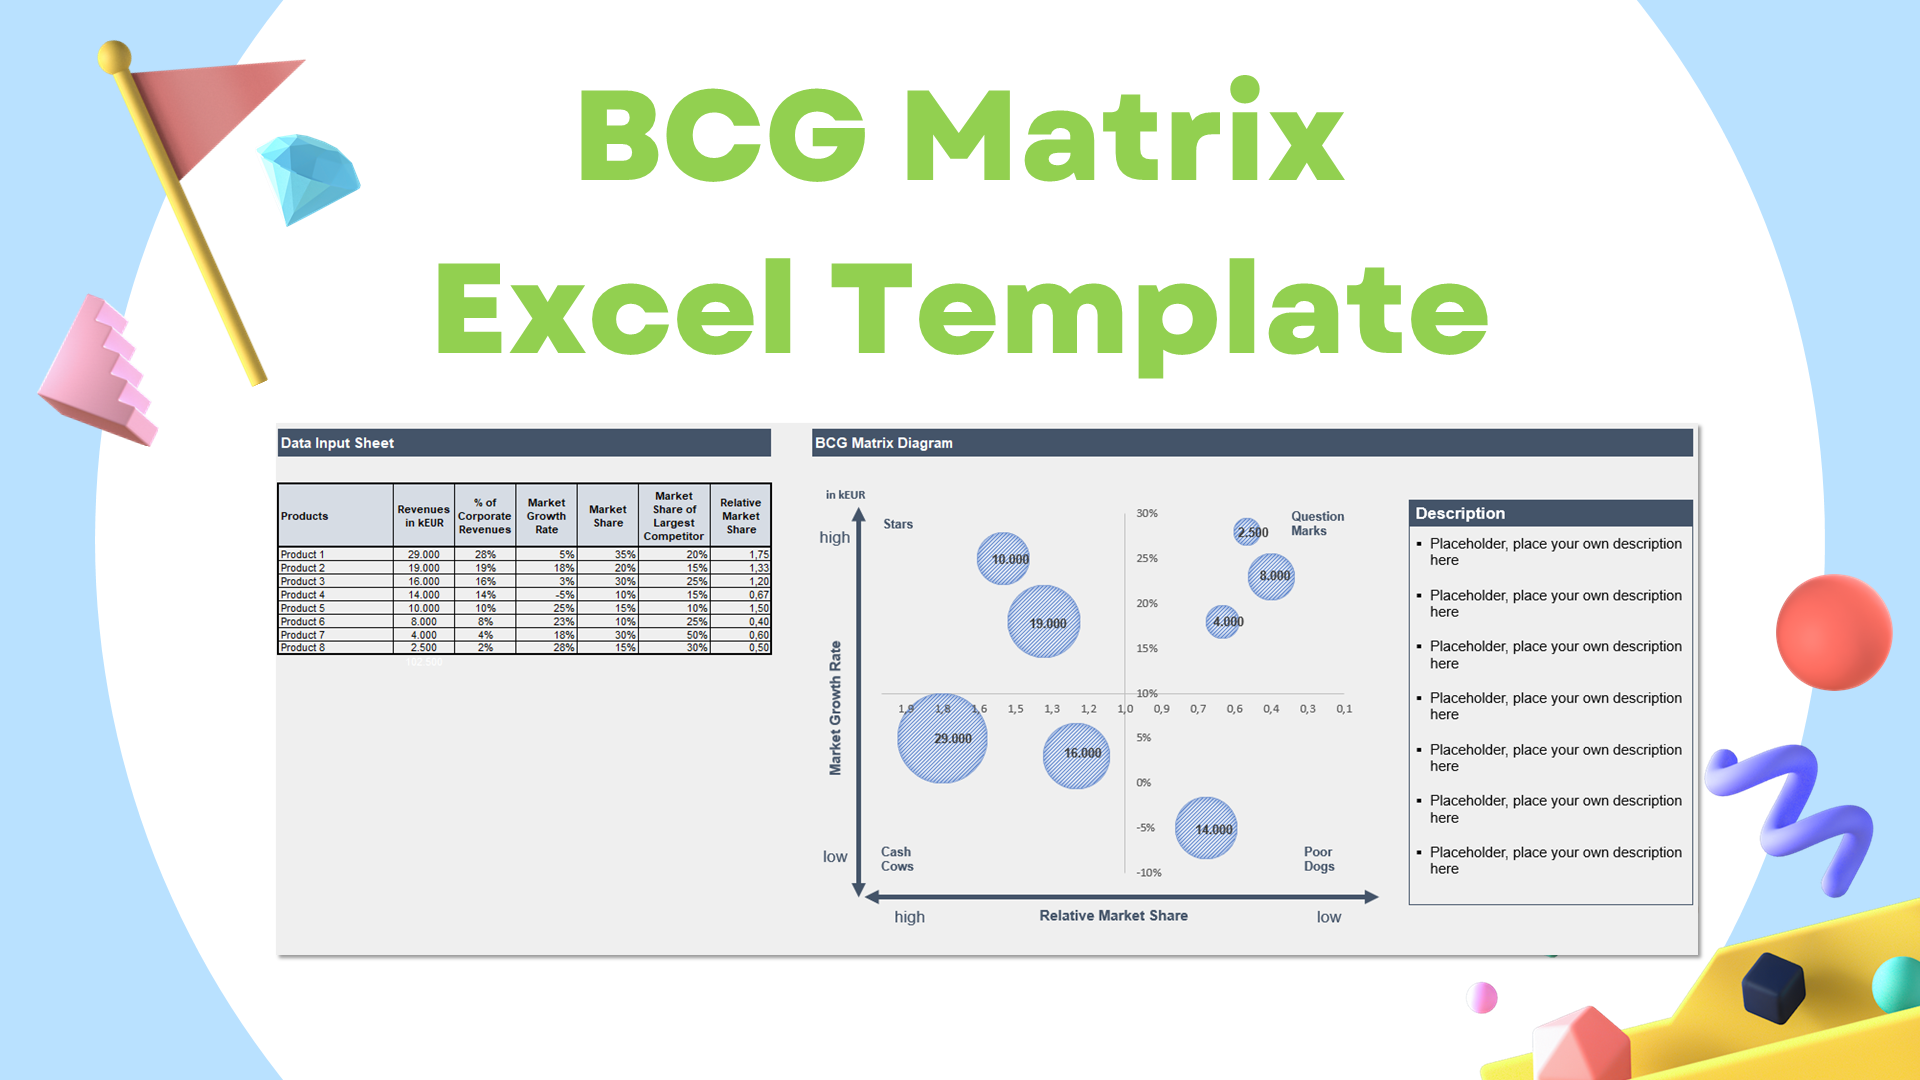
BCG Matrix Excel Template
BCG Matrix: Free PowerPoint Template
StrategyPunk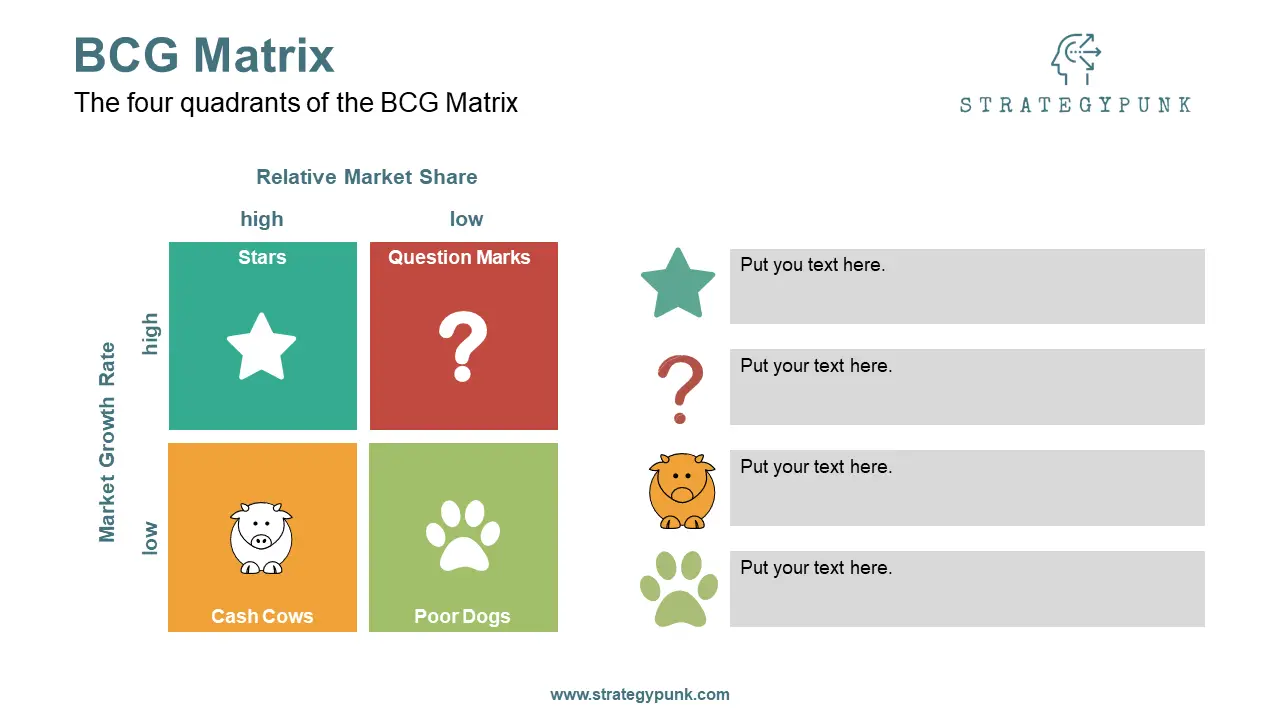
BCG Matrix PowerPoint Template
Summary
The GE-McKinsey Nine Field (or Box) Matrix framework systematically prioritizes investments among products or business units.
In a world with increased competition and limited resources, deciding which business unit or product portfolio to allocate capital and other resources is critical for a company's future success. This template helps you to address the complexity of the decision process.
The GE-McKinsey Nine Field with nine cells indicates whether the company should invest in a business unit or product, harvest it, or do further R&D if there are still resources. In the worst case, the business unit or product should be divested.
In the model, the business unit or products are evaluated on two axes: industry or market attractiveness and the competitive strength of the respective unit or product.
GE-McKinsey 9 Nine-Field Matrix - PowerPoint Template
Free and fully editable templates
Our free and fully editable GE-McKinsey Nine-Field Matrix PowerPoint template is a powerful tool for businesses to assess their portfolio and make strategic decisions.
The template is designed to be user-friendly and easy to customize. It allows businesses to input their data and analyze their portfolio using the nine-cell matrix.
The template includes a pre-built nine-cell matrix, with industry/market attractiveness and competitive strength axes clearly labeled.
Each cell is color-coded to indicate its strategic importance, making it easy for businesses to identify their most and least attractive business units.
The template also includes customizable text boxes for businesses to input their data and analysis and pre-designed icons and graphics to illustrate key points and data.
Overall, this template provides businesses with a powerful and flexible tool for analyzing their portfolio and making strategic decisions based on objective analysis.
With its user-friendly design and customizable features, businesses can easily tailor the template to their needs and goals.
GE-McKinsey 9 Nine-Field Matrix - Slide Deck Preview